Predicting Caffeine Intake
Team of 4 · UC Berkeley course project · Fall 2024 · Python
Can a student's lifestyle predict how much caffeine they drink? I built Python models to find out.
500
students in the dataset
5
model types built and compared
0.757
R² for the best model, a random forest
0.023
R² for plain linear regression
What I did
- Cleaned and prepared the dataset in Python with pandas: engineered sleep-duration features and encoded the categorical variables.
- Built and compared linear regression, LASSO, a neural network (MLP), a convolutional network (CNN), and a random forest.
- Wrote the linear regression by hand from the normal equations, then compared it with the library version.
- Tuned each model with grid search and cross-validation.
- Found that the random forest predicted best by a wide margin, which means caffeine use depends on how factors interact, not on any one factor.
Results
| Model | R² | MSE | MAE |
|---|---|---|---|
| Linear regression (OLS) | 0.023 | 0.515 | 0.639 |
| Linear regression (LASSO) | -5.073 | 3.204 | 1.636 |
| Neural network (MLP) | -0.760 | 0.515 | 0.639 |
| Neural network (CNN) | -0.437 | 0.758 | 0.538 |
| Random forest | 0.757 | 0.128 | 0.096 |
Higher R² is better; 1.0 is a perfect fit and anything below 0 is worse than guessing the average.
Engineering detail
The full story for anyone who wants to dig in: design decisions, numbers, and what didn't work.
The question and the data
We used a dataset of 500 university students with 14 variables: age, gender, university year, sleep duration and timing, study hours, screen time, physical activity, sleep quality, and the number of caffeinated drinks per day. The goal was to predict caffeine intake from the other variables and see which approach does it best.
Cleaning and feature work
- Computed weekday and weekend sleep duration from the start and end times, handling sleep that crosses midnight, then dropped the raw time columns.
- Dropped Student ID as irrelevant and Sleep Quality as subjective junk data, since what counts as good sleep differs from person to person.
- Encoded gender and university year as integers so the models could use them.
- Simplified the target. Ten caffeine bins with only 500 rows gave poor models, so I grouped intake into three classes: light (0 to 2 drinks), medium (3 to 4), and heavy (more than 4).
A correlation matrix showed that no single feature drives caffeine use. The strongest, weekday sleep duration, had a correlation of only 0.08. That told us early that a model would have to combine features to predict anything.
The five models
| Model | How it was built and tuned |
|---|---|
| OLS regression | Written by hand: centered the inputs and outputs, then solved θ = (XᵀX)⁻¹XᵀY for the parameters and the intercept. |
| LASSO regression | Scikit-learn, with 5-fold cross-validated grid search over regularization strength. Best α was 2.07. |
| MLP neural network | Grid search over 648 combinations (batch size, epochs, activation, dropout, layer width, optimizer) with 3-fold cross-validation. Best: one 256-neuron tanh layer, 0.2 dropout, Adam, batch 32, 50 epochs. |
| 1-D CNN | Same architecture and settings as the MLP, to see whether convolution helps on these features. |
| Random forest | Swept 10 to 500 trees and two feature-sampling rules. Trained on a 90/10 train-test split with a fixed random seed for reproducibility. |
What the training curves showed
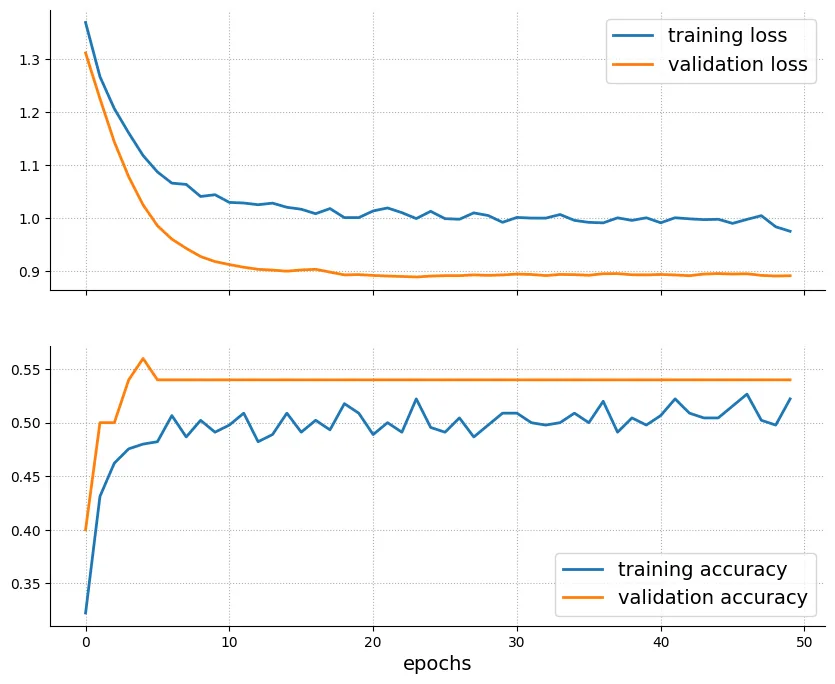
The MLP's validation loss leveled off early with a small gap to training loss, so it wasn't overfitting, and its metrics stopped improving at around 20 epochs. The CNN started to overfit: validation loss fell for about 10 epochs and then rose while training loss kept dropping. For future runs, I would stop the MLP near 20 epochs and the CNN near 10.
What it means, and the caveats
Linear models failed because caffeine use isn't a straight-line function of any one habit. The random forest captured interactions between variables, for example how screen time, study hours, and sleep combine, and explained about 76% of the variance in the held-out data.
Some honest caveats. With 500 rows, the 10% test set is only 50 students, so the random forest's score has real uncertainty, and the grid search picked a small forest (10 trees). The neural networks likely lost because of the small dataset and limited tuning, not because the approach is wrong. A larger dataset is the obvious next step.